- The Nebraska Planner
- Posts
- Radon Risk Assessment
Radon Risk Assessment
Mapping Risk in Nebraska for Informed Urban Planning Decisions
Rao Nargis Jahan & Kurt Elder
July 10, 2025
As planners, our work often revolves around tangible, zoning ordinances, infrastructure layouts, and land use maps. Yet, our responsibility to protect communities extends far beyond the visible. One of the most overlooked threats to public health in Nebraska is entirely invisible: radon gas.
Radon is a naturally occurring radioactive gas released from the decay of uranium found in soil and rock. In the Midwest, glacial activity from thousands of years ago left behind uranium-rich deposits, particularly in Nebraska. As uranium naturally breaks down, it off-gasses into radon, an invisible, odorless, and tasteless threat. It is the leading cause of lung cancer among non-smokers. Due to this unique geological profile, Nebraska consistently reports radon concentrations well above the EPA’s action level of 4.0 picocuries per liter, which is the level at which mediation is required.1
A Health Imperative Meets a Planning Opportunity
At the 2025 Nebraska GIS Symposium, we presented a project that merged spatial analysis with predictive modeling to identify radon-prone areas in Lincoln. Aimed at equipping planners, developers, and public health officials with hyper-local insights, this work underscores the need for data-driven decisions in neighborhood-level planning. With universal testing limited by federal guidelines and funding, predictive tools offer a practical solution to pinpoint high-risk zones and guide targeted interventions.
A Smarter, Spatially Enhanced Approach
We analyzed over 85,000 records from radon tests collected by the Nebraska Department of Health and Human Services (2015-2023). By implementing federal regulations1 on how to estimate radon levels at the parcel levels based on proximity to existing test sites, we were able to produce estimated radon risk maps with a fine level of precision, which is a significant leap beyond the traditional county-wide classifications. Where direct test results were available, modeled values were replaced to enhance reliability. Median values for modeled parcels showed up to 7.25 pCi/L, with adjacent site medians climbing to 11.4 pCi/L, reinforcing how localized and elevated risk can be.
These findings highlight a critical need: we cannot rely solely on broad averages. Community safety demands that we drill down, literally and figuratively, to understand risks at the household level. While we have parcel level estimates ready, we acknowledge the only true way to know if your home has radon is by testing. Thus, our effort are best used by local health districts and appropriate city staff.
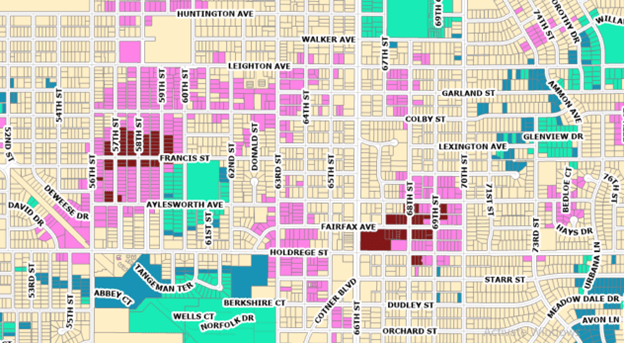
Radon Results in Lincoln, NE
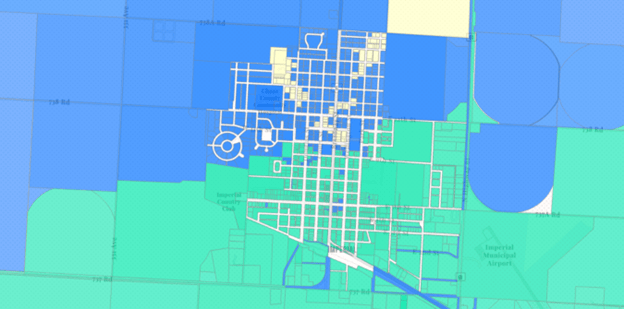
Radon Results from Imperial, NE
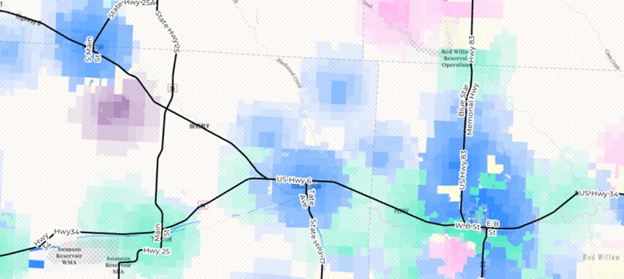
SW Nebraska – Transparency reflecting distance from nearest tests. More transparent means the test was further away.
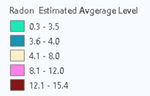
Note: Legend above applies to all 3 maps
Beyond the Data: Planning for Health Equity
Our radon risk assessment also uncovered a familiar pattern, that older homes, many in lower-income neighborhoods, are disproportionately affected. These structures are less likely to have radon mitigation systems.
Planning codes and land use decisions must now catch up with this science. Building radon-resistant homes is significantly more cost-effective than mitigating existing ones, yet policies often fail to require such features in high-risk zones. With that stated, since 2018 new homes in Nebraska are required to have mitigation systems installed. None-the-less public awareness remains low, and even basic mitigation efforts are a financial burden for many.
Policy Recommendations for Nebraska
Managing radon risk in Nebraska calls for a policy framework grounded in sound planning practices, with a focus on public health and equitable mitigation. Implementing mandatory radon testing every three years in public buildings, particularly in schools and daycare facilities can ensure timely detection in environments occupied by vulnerable populations. Updating statewide building codes to mandate radon-resistant construction, when re models are taking place, in identified high-risk areas supports long-term prevention. Establishing a $2 million annual mitigation fund would help ensure access to testing and remediation for low-income households that may otherwise face barriers. Additionally, incorporating radon risk modeling into zoning, permitting, and subdivision review processes allows for more data-driven, proactive planning decisions. Collectively, these measures form a cohesive strategy to reduce radon exposure and enhance community health across the state.
Such measures are not just regulatory milestones, they are lifelines. With estimated mitigation costs of $1,500-$2,000 per home, early prevention will not only save public funds but lives also.
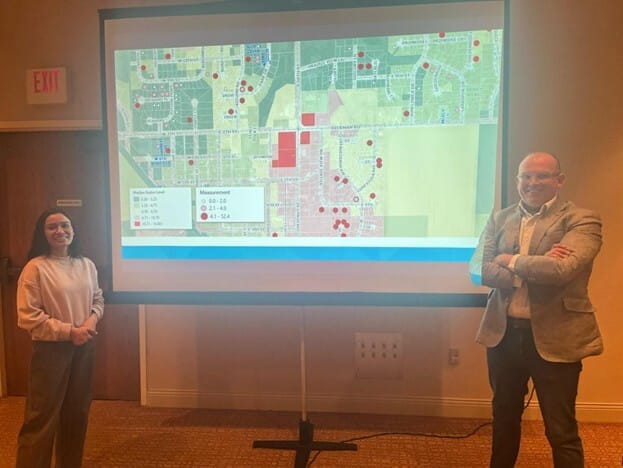
Nargis & Kurt presenting at the 2025 NE GIS/LIS Conference
What’s Next?
Despite its significant health risks, radon remains largely absent from mainstream planning conversations, yet it deserves far more attention. With its proven link to lung cancer and its prevalence in Nebraska, addressing radon should be a priority in every planner’s toolkit. Its invisibility is precisely what makes it so insidious. Through initiatives like this, Nebraska can become a model for how small investments in geospatial tools and data-driven planning can produce meaningful public health outcomes.
Let’s work toward a future where no Nebraskan family unknowingly breathes carcinogenic air in their own home, not because they were lucky enough to test, but because our planning systems were wise enough to anticipate.
Interested in learning more or collaborating on radon-related planning initiatives? Reach out to Kurt Elder ([email protected]) or Rao Nargis Jahan ([email protected]).
1 Federal regulations state that we identify the nearest 10 tests and find the average as an estimate for a target property. We did this full all parcels in the state (i.e., approx. 1.2M parcels). The resulting analysis table was approx. 12 million rows. We later adjusted the opacity of the mapped result to reflect our additional criteria to denote where quality estimates were. This effort will be a future article.
Reply